Research
- Corporate Intelligence
- Applied Information Technology
- Demograhic Analysis
- Advanced Strategic Research
Training
- Community Organizing
- Corporate Research
- Database Development
- Research Techniques
- Technical Writing
- Geographic Information Systems
- Information
Based Presentation and Advocacy
Technical Support
- On Line Databases
- GIS
- Networks, Servers, Services
- Telephone Support Available
Information Technology Forum
Movementech's Environmental Justice
GIS Projects
Environmental Background Information Center (EBIC) began experimenting with Geographic Information Systems (GIS) in 1996 by gathering data and software from the Environmental Protection Agency. However, it did not become a major component of EBIC's work until 1998. In 2002, EBIC spun off a new organization called Movementech to do this work in earnest. For purposes of clarity, this web page describes work done by EBIC, which is now being carried forward by the same people, under Movementech.
Visualization through GIS of the environmental, health, racial and economic impacts of harmful corporate activities provides the opportunity to tranform a technology created for military purposes into powerful organizing, cen our board directed us to aggressively pursue GIS capability. Thanks to two grants of software and data from the Environmental Science Research Institute (ESRI) we have dramatically expanded our capacity to assist communities most in need ofommunication, and mobilization tools. What follows are brief discussions of some of our projects to date.
Fort Valley, GA (click for the full report)
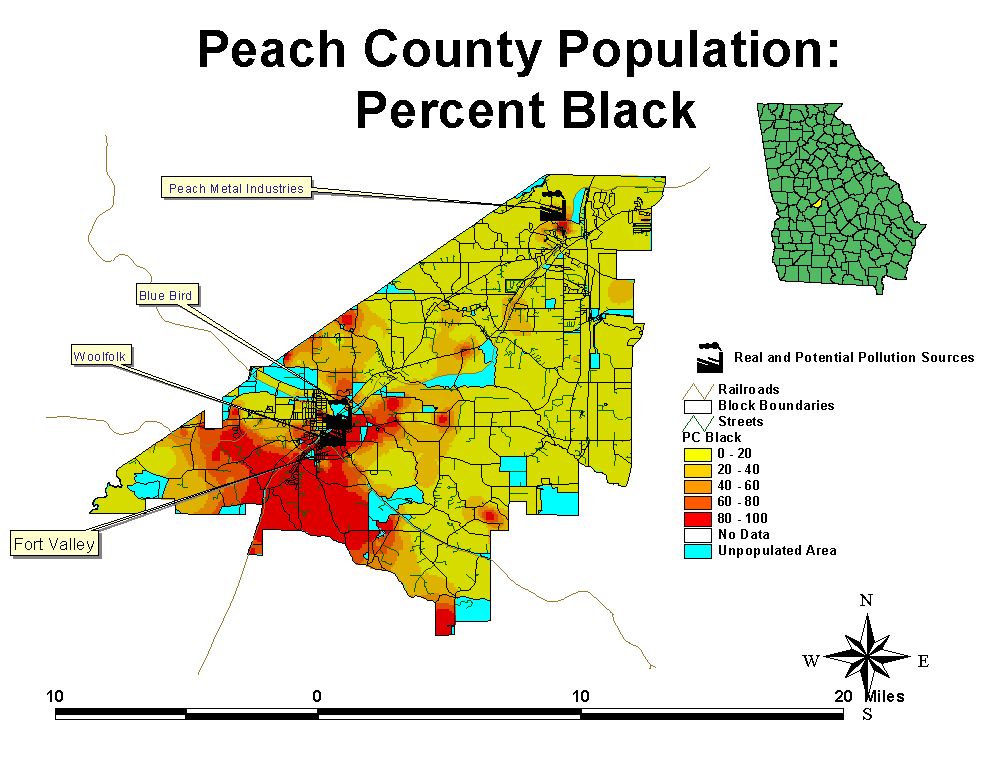
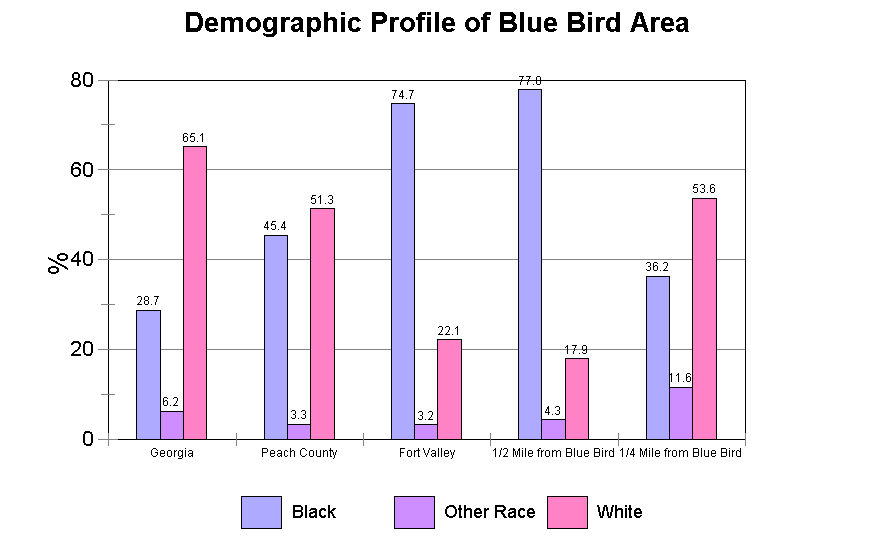
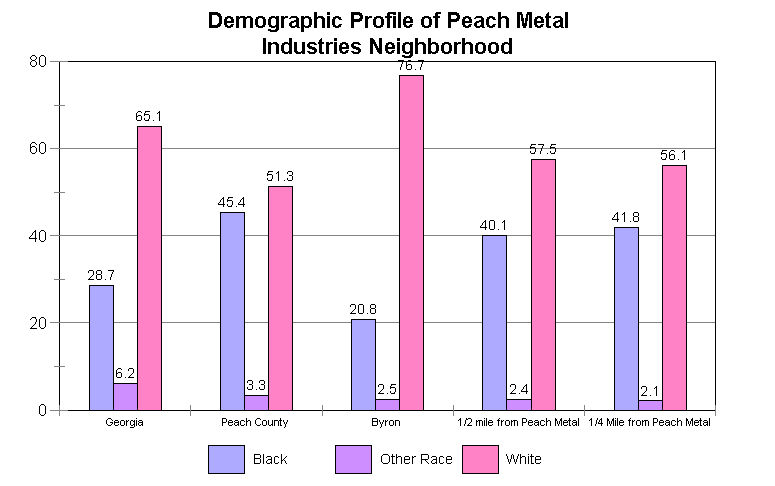
The Woolfolk Citizens Response Group (WCRG) is an organization formed to address community concerns surrounding the presence of the Woolfolk Chemical Works National Priority List (NPL) Superfund toxic waste site in Fort Valley, Georgia. Because of its experience with that site, WCRG has expanded its role over time to look at threats to the health, well being and future community development of Fort Valley and Peach County. The WCRG is assisting the Middle Georgia Advisory Group, a grassroots group in neighboring Byron, organize around such issues as a proposed regional landfill and an existing toxic waste site. Fort Valley, GA, a company town in Middle Georgia, is in Peach County (pop 23,688). According to 2000 U.S. Census Statistics, Peach County is 45.4% African American. Georgia is 28.7% African American. Fort Valley is predominantly African American (74.7%). 8,005 people reportedly lived in Fort Valley in 2000. 5,816 of that total population (72.7%) are of voting age. The voting age population in Fort Valley is 72% African American.
Peach
County hosts a number of existing environmental contamination
problems. Our analysis indicates that most of these facilities
are located in predominantly minority areas and that they may
pose ongoing threats to human health and safety. Moreover, historical
analysis of contamination problems in Peach County strongly suggests
that state enforcement of environmental laws has been insufficient
to protect the public from the threat of illegal activity harmful
to the enviroment and public health. This fact, taken by itself,
is enough to cause a reasonable person to have legitimate and
well grounded concerns about any new environmental health threats
to people in the county such as the Aldridge landfill might provoke.
It is quite clear that the best way to stop environmental contamination
in Peach County is to prevent activities that might cause that
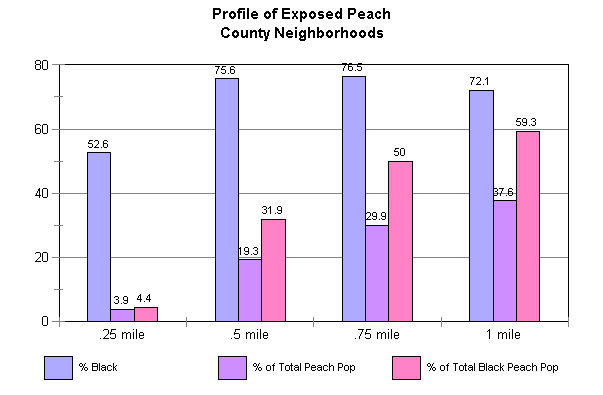
sort of harm, before they go into operation. Overall demographic
profiles indicate a larger than expected minority population impacted
by toxic threats in Peach County. For example, though only slightly
less than 20% of the entire population of Peach County lives within
3/4's of one mile from the three facilities discussed in this
report, the population that does live within 3/4's of one mile
is 75.6% black. Moreover, 50% of the black population of Peach
County lives within 3/4's of one mile from these three facilities.
Economic statistics also indicate a higher level of poverty, lower
income levels and slightly to moderately lower educational attainment
in census block groups containing the Woolfolk and Blue Bird facilities
respectively.
Status of this Fight: Ongoing
Citizen Campaign Focused on Community Needs
 Peach County Percent Black 1apeachpcblack.jpg 134.83 Kb |
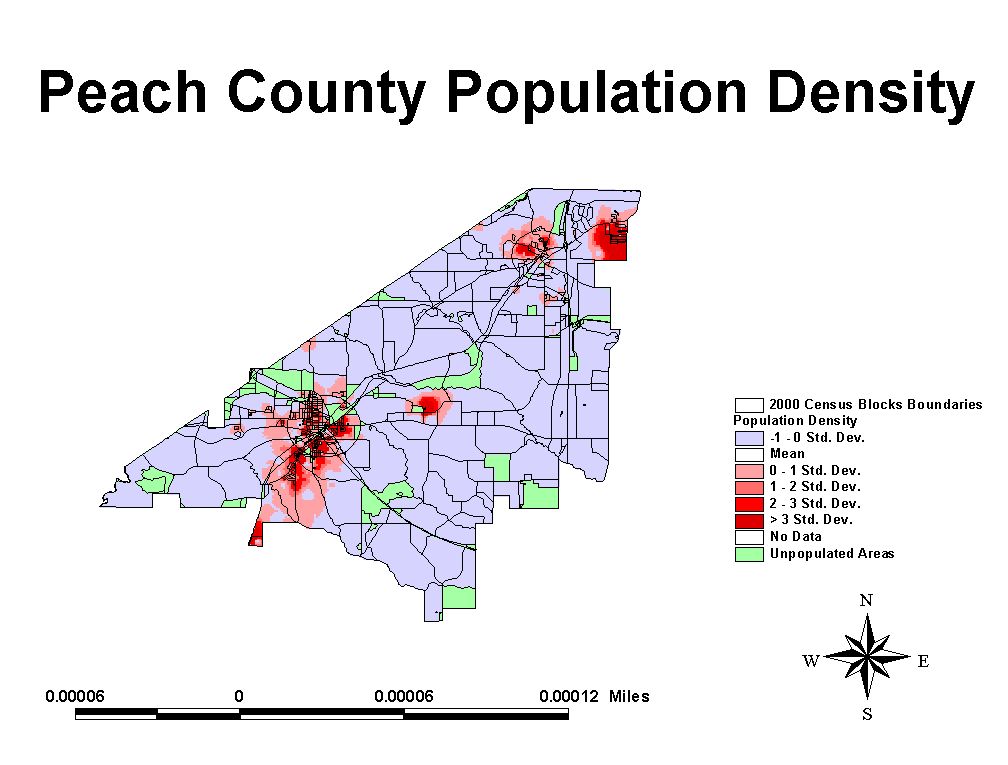 Peach County Population Density 1bpeachpopdens.jpg 93.46 Kb |
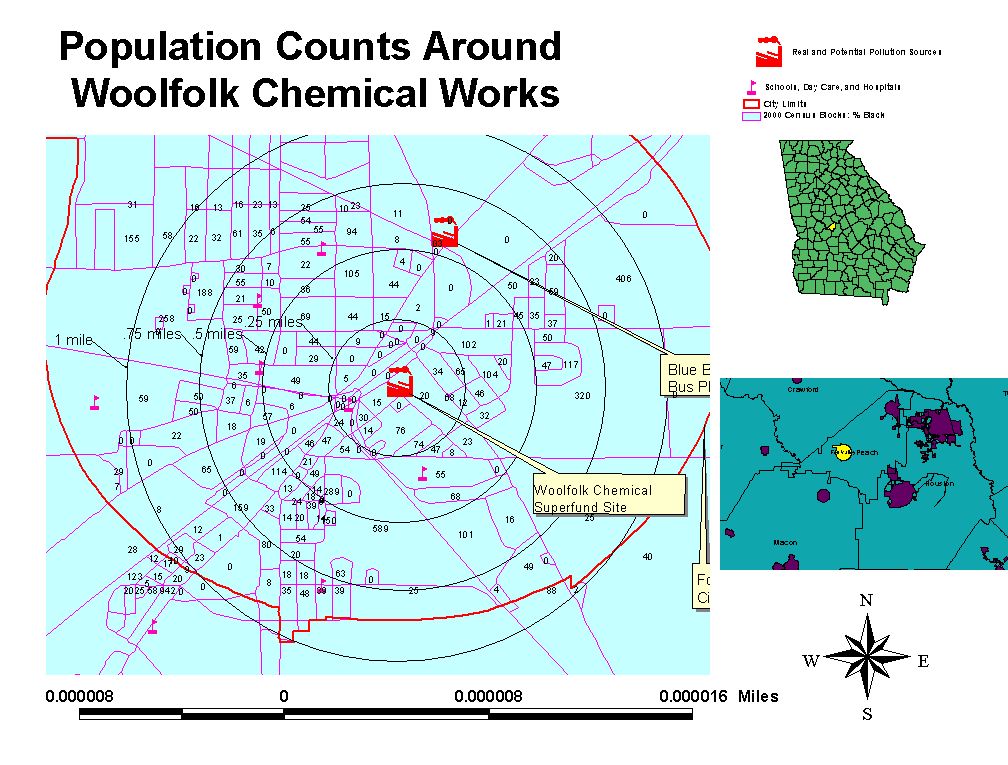 Fort Valley Population Counts 1cwoolfolkpop.jpg 173.09 Kb |
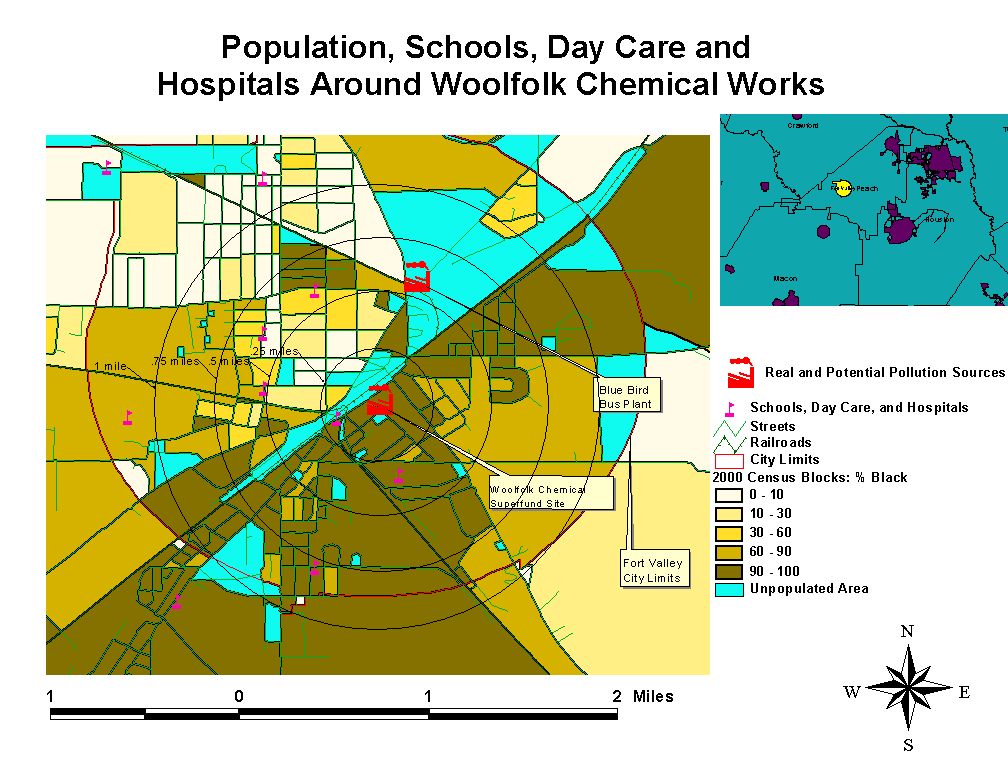 Fort Valley Schools Percent Black 1dwoolfolkpop2.jpg 161.00 Kb |
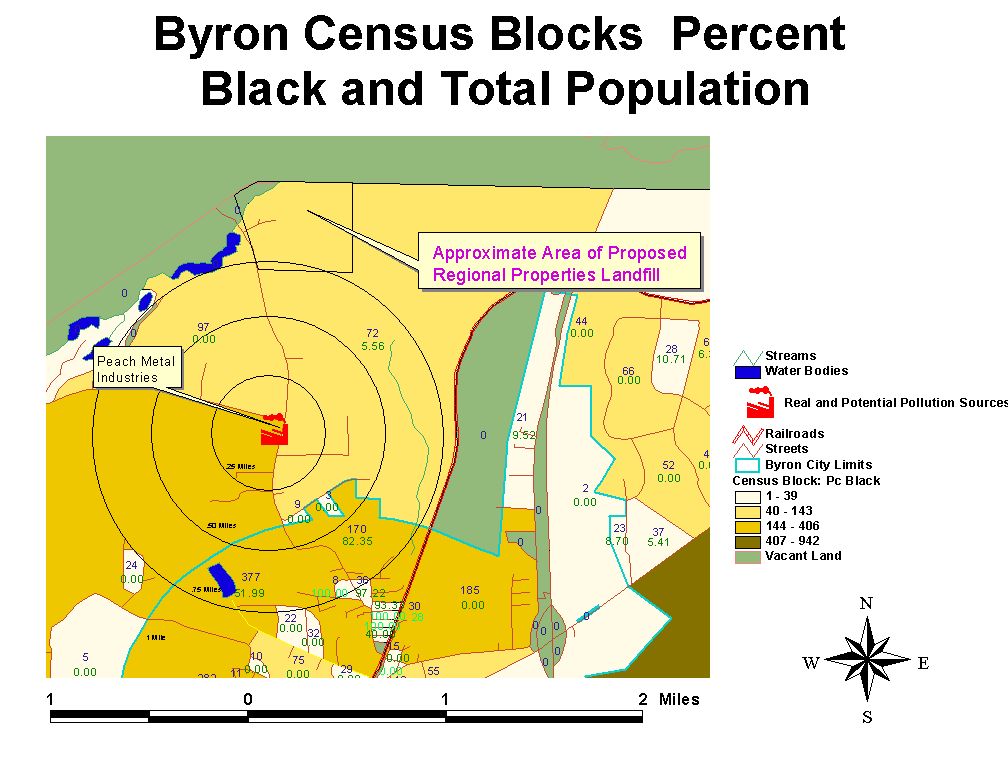 Byron Percent Black 1ebyron1.jpg 123.53 Kb |
 Fort Valley Household Income 1ffortvalley.jpg 221.23 Kb |
 Woolfolk Demographic Profile 2awoolfolkprofile1.jpg 30.56 Kb |
 Blue Bird Demographic Profile 2bbluebirdprofile1.jpg 43.54 Kb |
 Peach Metals Demographic Profile 2cpmiprofile1.jpg 43.22 Kb |
 Peach County Demographic Profile 1 2dpeachprofile1.jpg 33.82 Kb |
 Peach County Demographic Profile 2 2epeachprofile2.jpg 29.24 Kb |
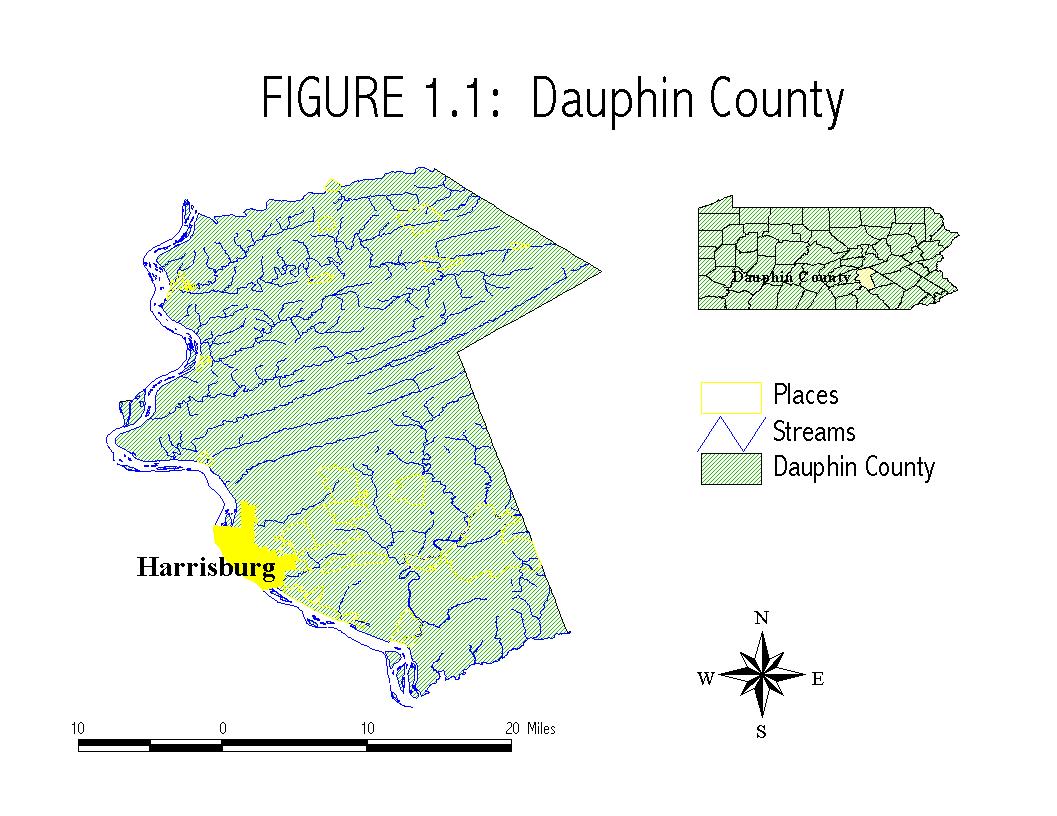
- According to1990 census data, the statewide median household income of Pennsylvania is $29,069 and the racial composition is 88.5% white, 9.2% black, and 2.0% Hispanic. In Dauphin County, where Harrisburg is located, the median household income of $30,985 and the racial composition is 82.4% white, 15.0% black, and 2.5% Hispanic (see map 1.1). These statistics reveal that the state and county populations are roughly equivalent in terms of income and race.
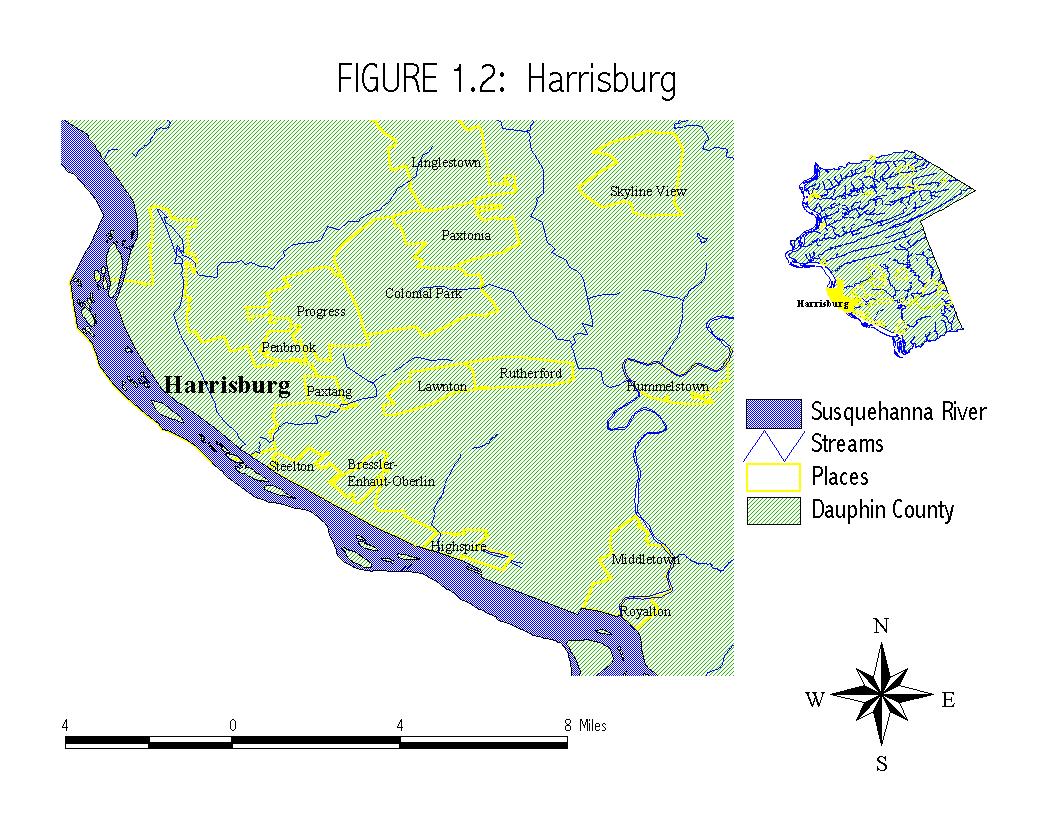
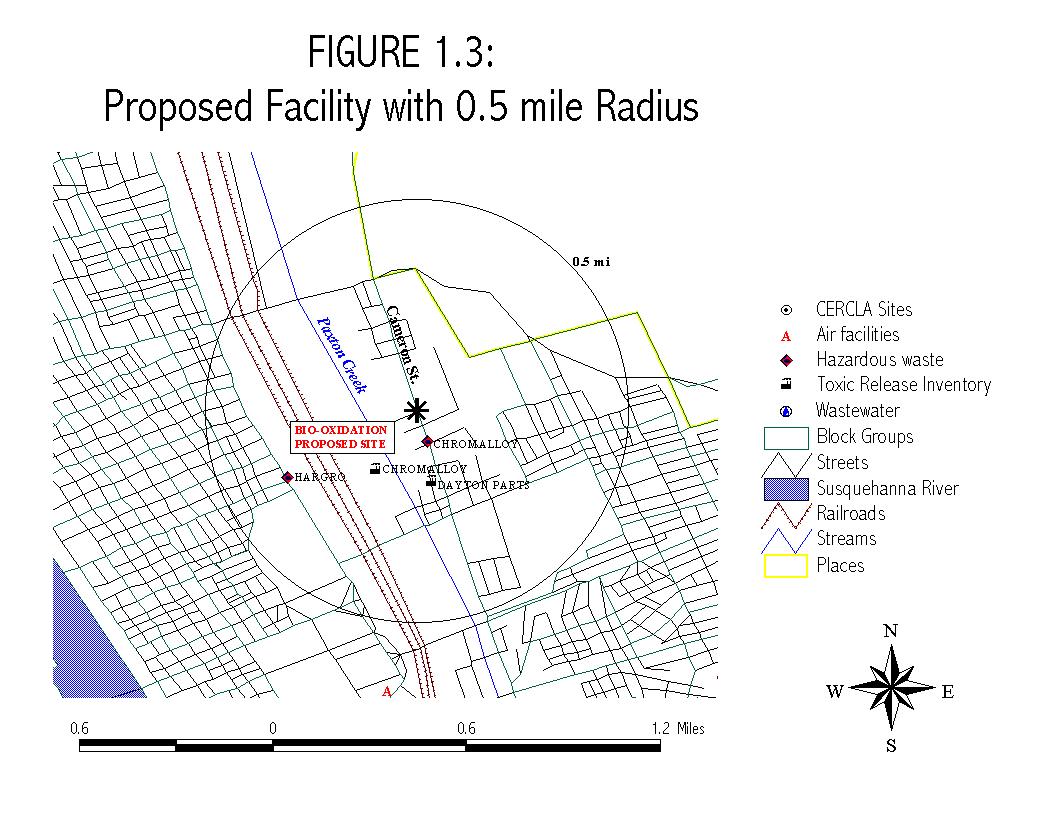
- Harrisburg City has a median household income of $20,329 and a racial composition of 42.6% white, 50.6% black, and 7.7% Hispanic (see map 1.2). Within a 0.5 mile radius of the proposed site, there are 5 census block group centroids representing 2,648 people. The median household income for this half mile radius is $20,368 and the racial composition is 13.7% white, 80.9% black, and 7.4% Hispanic (see map 1.3). These figures show an increasing minority population and a decreasing median household income as we move into Harrisburg City and closer to the proposed facility.
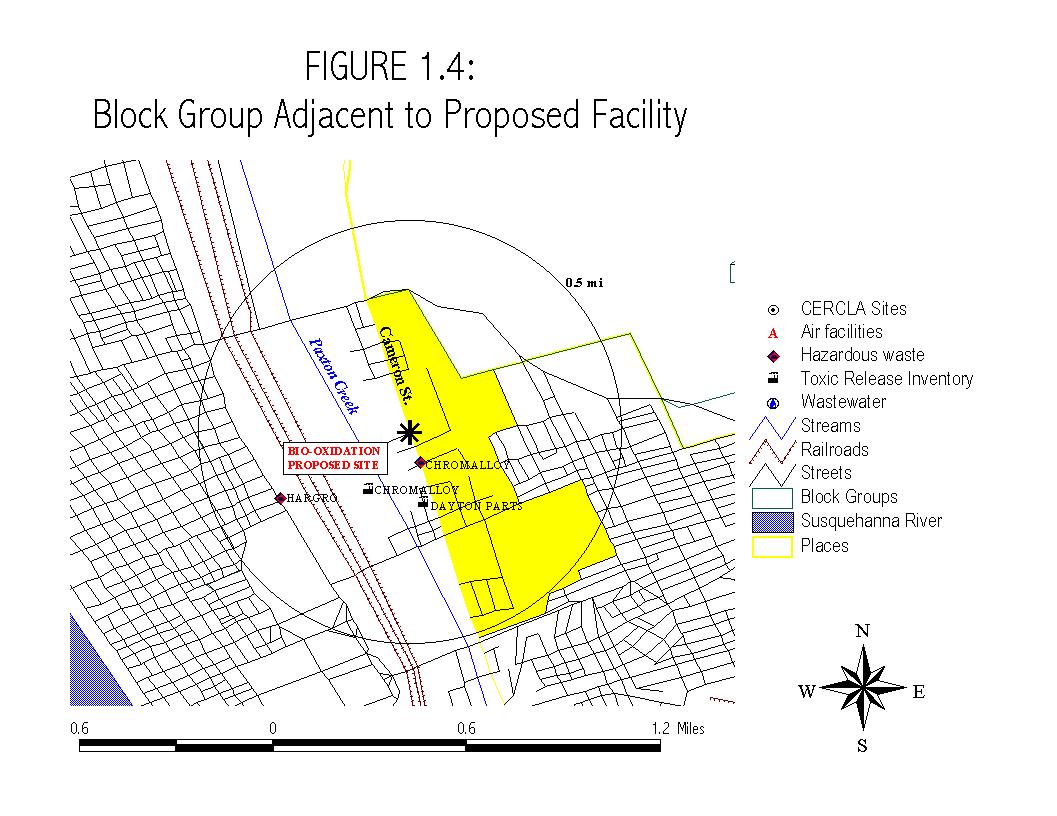
- The census block group that is directly adjacent to the proposed facility at 1745 Cameron St. contains 1,171 people. Here the median household income is $5,974, which is only about one fifth of the median household income average for both the state and the county. Of the residents in this block group, only 10.5% are white, while 81.4% are black and 12.0% are Hispanic. Another interesting characteristic of this population is that there is a relatively large percentage of children. 37.5 % of this population is under 10 years of age, as compared to 13.3% statewide, 13.6% countywide, and 16.4% citywide and 23.7% within 0.5 miles (see map 1.4).
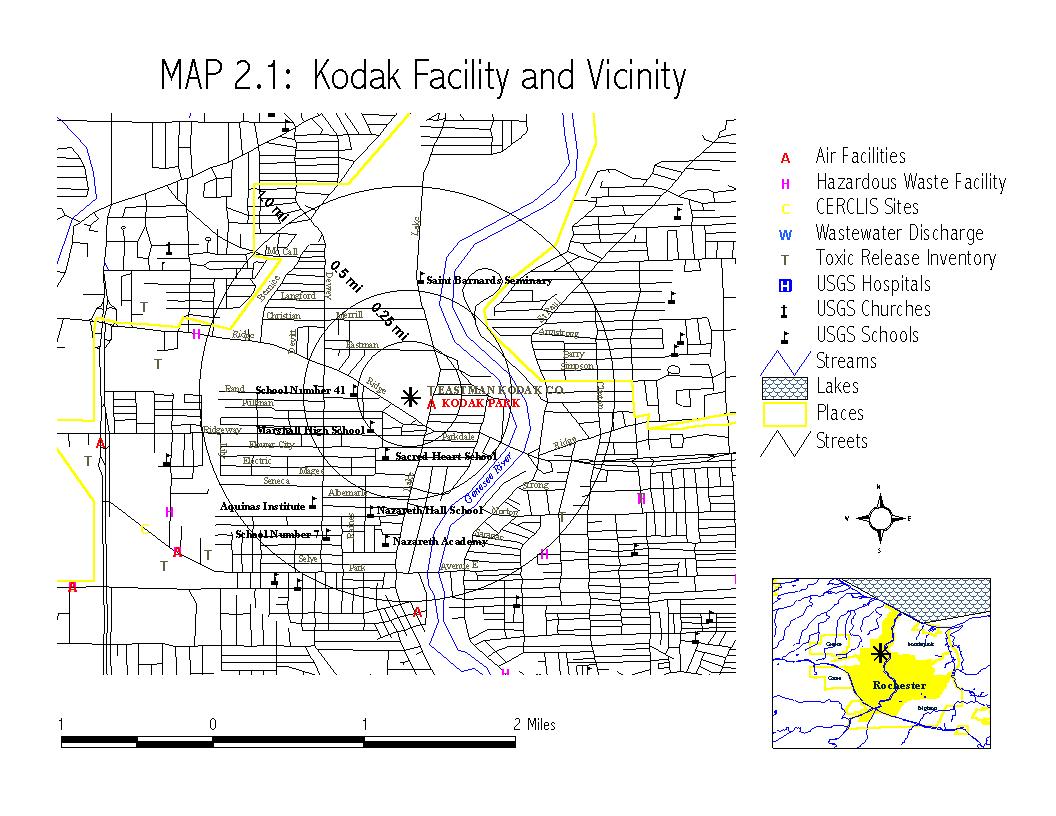
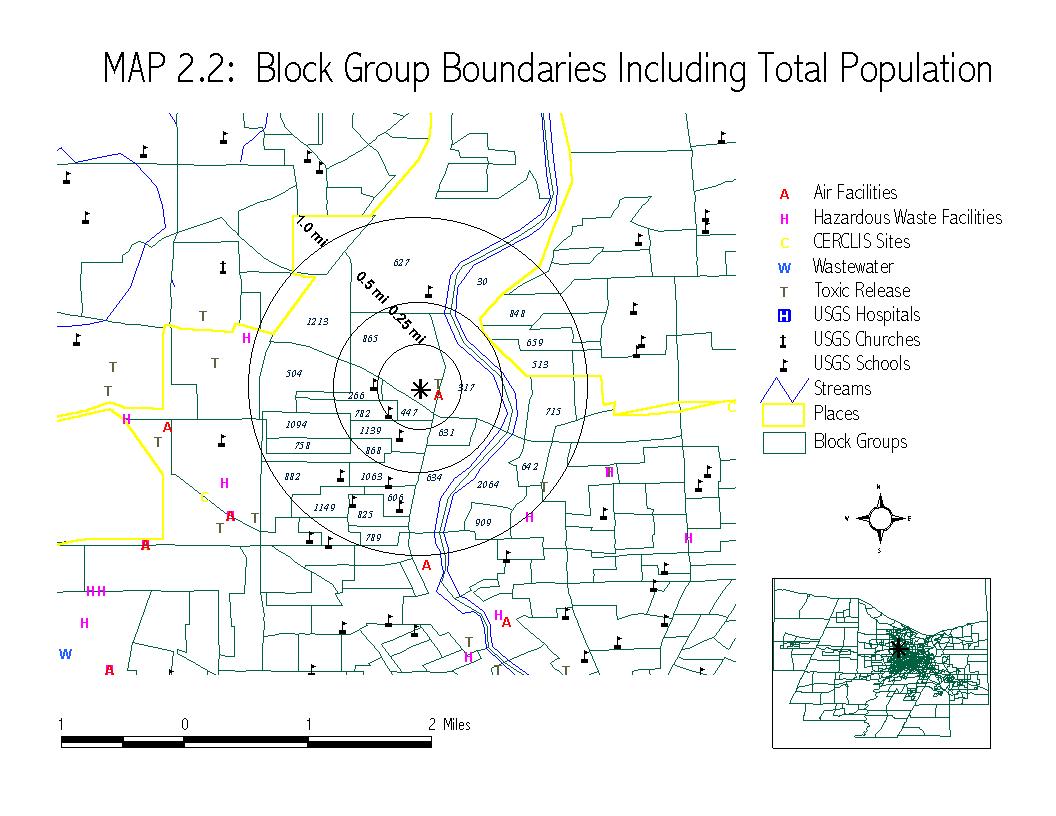
- According to the 1990 Census, over 20,000 people, representing a broad diversity of races, classes and ages, live within a mile of the Kodak facility. These people are especially susceptible to the effects of "fugitive" air pollutants which escape from unidentified locations around the plant. There were over 500,000 pounds of fugitive air emissions from Kodak in 1996 (see map 2.2).
- The census block groups within a half mile of the Kodak facility contain a higher than average concentration of children under the age of 10, when compared to the rest of the block groups in Monroe County. There are also three schools located less than a half mile from the facility(see maps 2.1 and 2.5).
- Other groups of sensitive and/or disadvantaged populations also reside in or just outside the one mile radius, including elderly, minority, and impoverished people (see maps 2.3, 2.4 and 2.6). For instance, map 2.3 shows that most of the block groups within a half-mile radius of the Kodak plant have incomes that are significantly below the average for block groups in Monroe County, which is $33,518. Map 2.6 shows that higher concentrations of elderly residents are clustered near the edge of the half-mile radius on the eastern side. Notice that the poorest block group has a relatively high concentration of elderly citizens at 29.2%. This block group would certainly represent a high risk population for health problems that could be exacerbated by exposure to the types of chemicals that Kodak routinely releases.
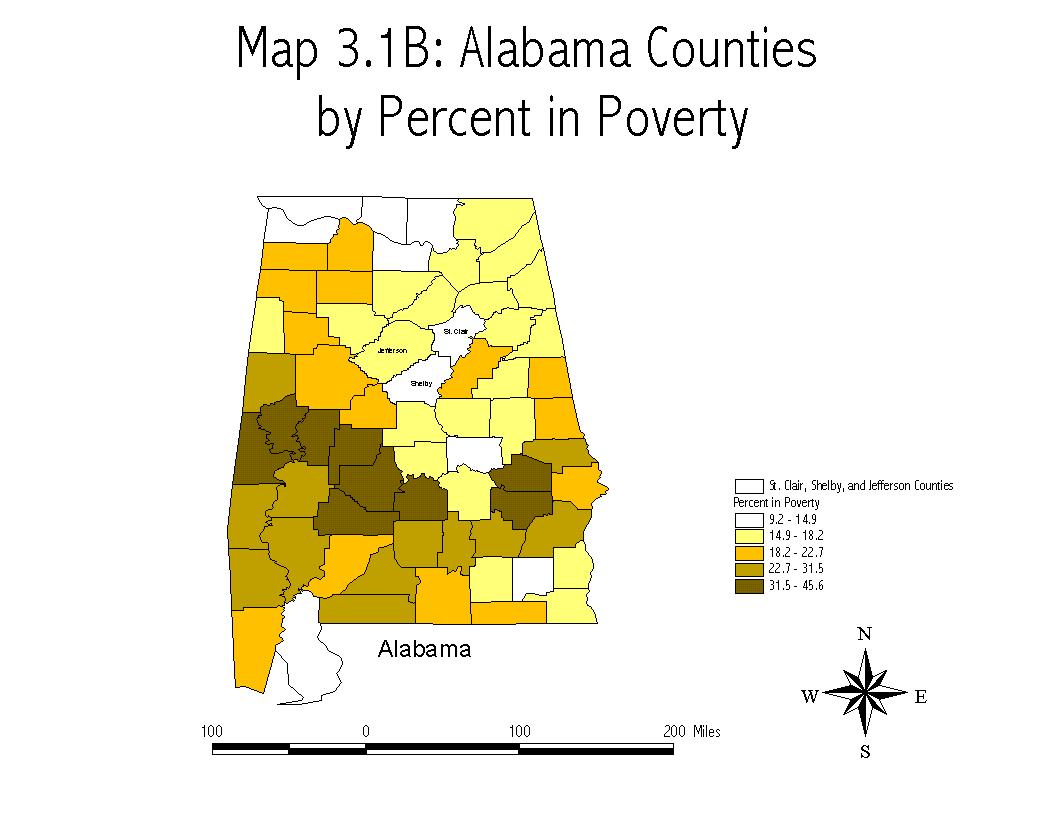
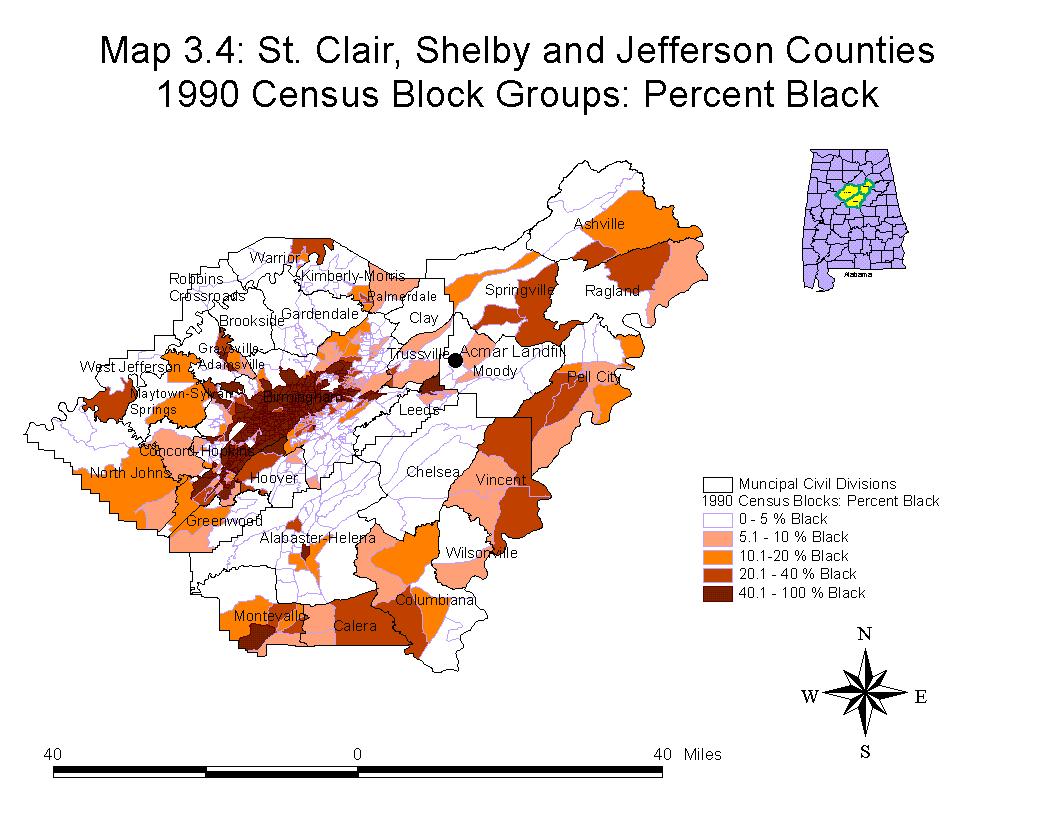
- Map 3.1 shows the statewide context for the study area. Moody is in the Southwest corner of St. Clair County which places it on the border of Shelby and Jefferson Counties. Based on 1996 figures, St. Clair, Jefferson, and Shelby counties have estimated populations of 88,000, 662,000 and 127,000, respectively. Jefferson County, where Birmingham is located, is the most populated county in Alabama (map 3.1A). Jefferson County also has the largest minority population in the state, whereas St. Clair and Shelby counties have two of the smallest minority populations in the state (map 3.1C).
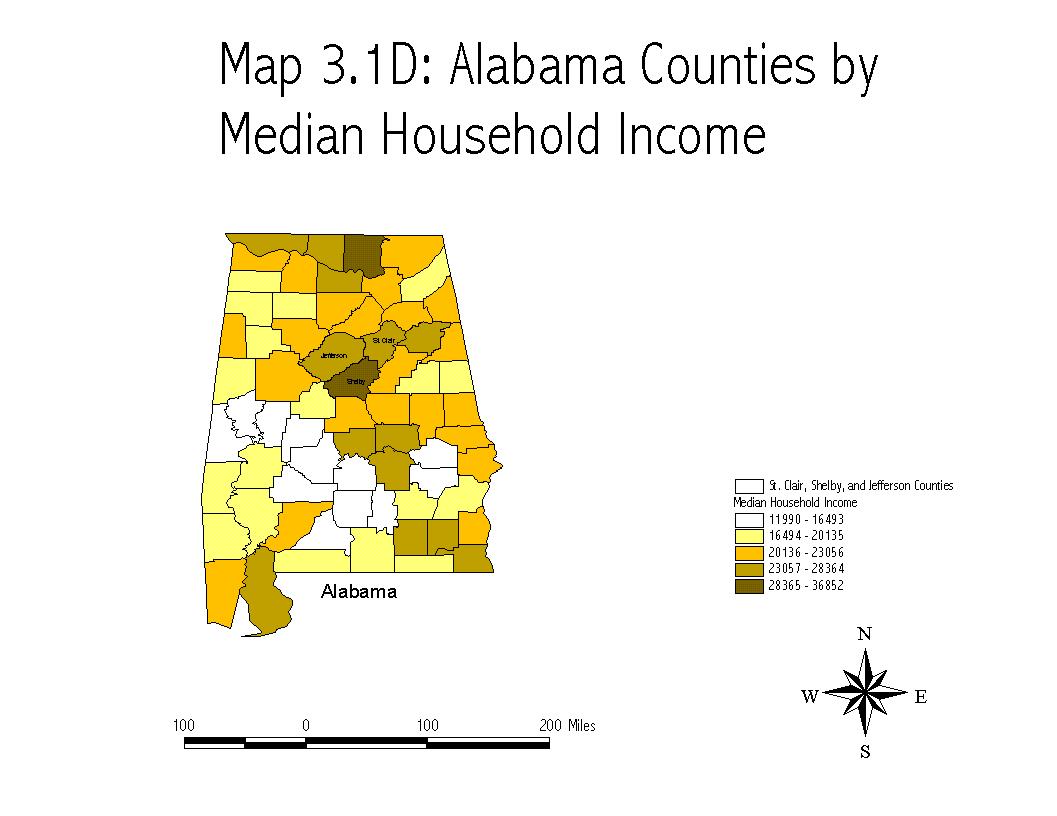
- St. Clair County is a relatively affluent and has one of the lowest rates of poverty in the state (map 3.1B). In terms of median household income, all three counties are fairly well-to-do. In fact, Shelby County has one of the highest median household incomes in the state (map 3.1D).
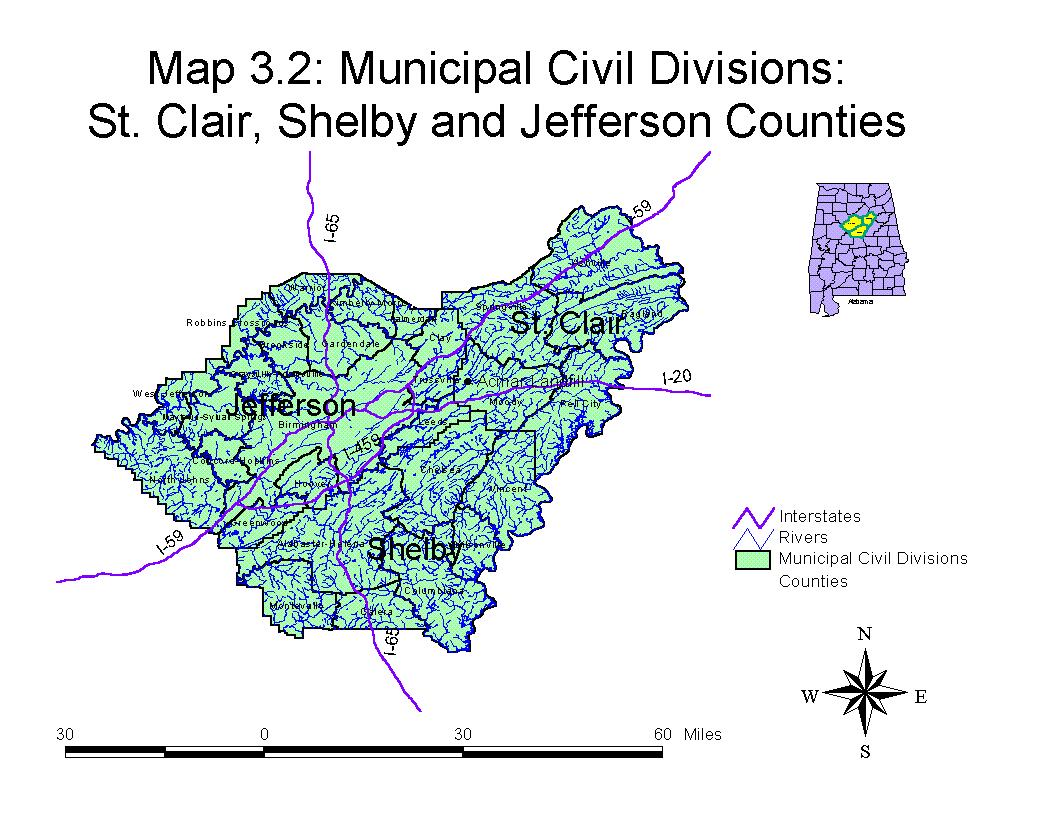
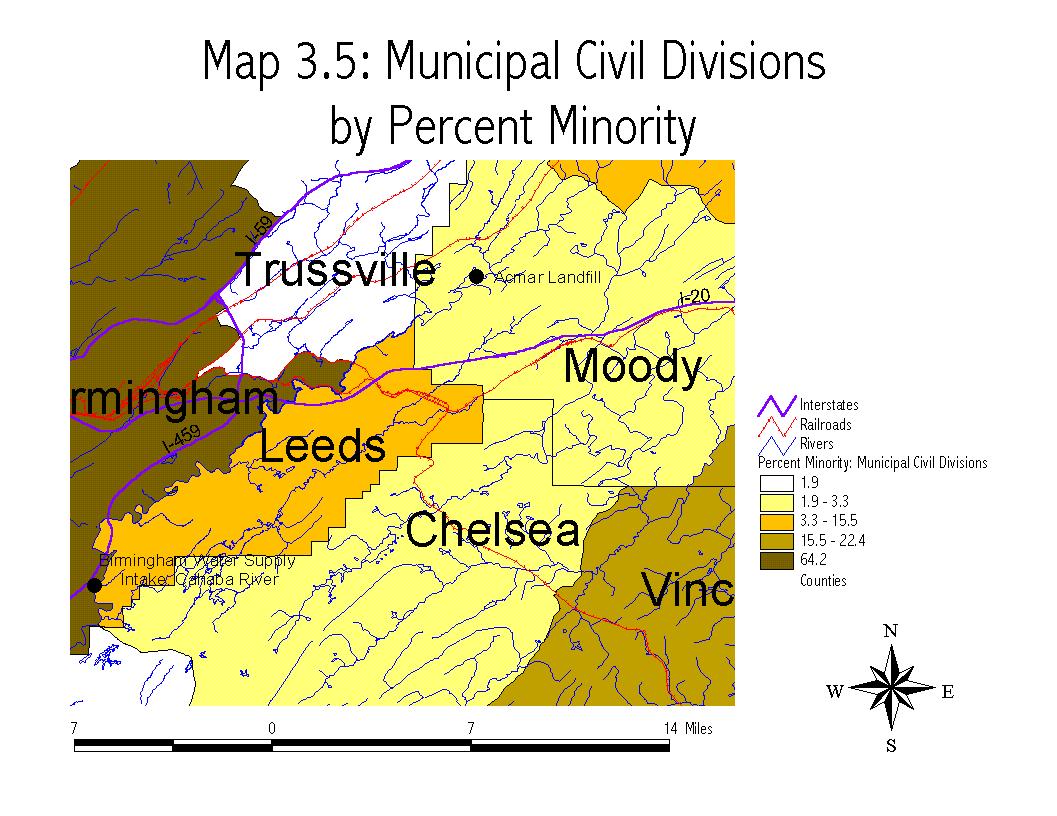
- Moody is in the Southwest corner of St. Clair County which places it on the border of Shelby and Jefferson Counties. Leeds, Alabama, in Jefferson County abuts Moody in St. Clair and Chelsea abuts Moody in Shelby County (maps 3.2 and 3.5). The landfill in Moody sits between two branches of Big Black Creek. These two branches feed into the Cahaba River. The Cahaba runs southwest along the border of Leeds and Trussville and from there along the southern border of Birmingham. The intake for Birminghams water supply is on the Cahaba River about 14.5 miles as the crow flies from the Acmar Landfill (maps 3.3 and 3.5).
- The Cahaba river is Birminghams water supply, and, in turn, Birmingham supplies water to Moody. Thus an illegal landfill operation has been taking place directly in the watershed for the drinking water supply for Birmingham and Moody (maps 3.3 and 3.5). Put differently, a landfill with a history of legal violations and alleged ties to organized crime is being operated in the water supply for the largest population segment in the state - with the highest minority population in the state - as well as the water supply for an affluent municipality in one of the more affluent, whitest counties in the state (see map 3.4) . The Cahaba river also flows through some of the most affluent neighborhoods in Birmingham (map 3.3).
- 11 of the 12 facilities examined were located in or adjacent to block groups in which a significantly higher percentage of the population is composed of minorities than the parishes as a whole.
- 11 of the 12 facilities were located in or adjacent to block groups with significantly higher poverty levels than the parishes as a whole.
- All of the facilities have large numbers (greater than 15 for each) of schools and churches within a 2.5 mile radius.
- 5 of the twelve facilities were located in or adjacent to block groups that contained a significantly higher proportion of the elderly (over age 65) or of children (under age 10). These populations are especially vulnerable to toxic pollution.
- Chester City is the fourth largest municipality in Delaware County. The city has the highest percentage of minority residents and the highest poverty rate in the county. Chester has the lowest median income, the third lowest rate of home ownership, and one of the lowest rates of educational attainment in the county.
- 7.6 %
of the population of Delaware County lives in Chester City.
10.1% of the population of Delaware County lives in 5 municipalities
centered around Chester (Chester City, Chester Township, Eddystone,
Trainer, and Upland). There are 49 separate municipal divisions
in Delaware County so those five municipalities constitute 10%
of the municipalities in the county.
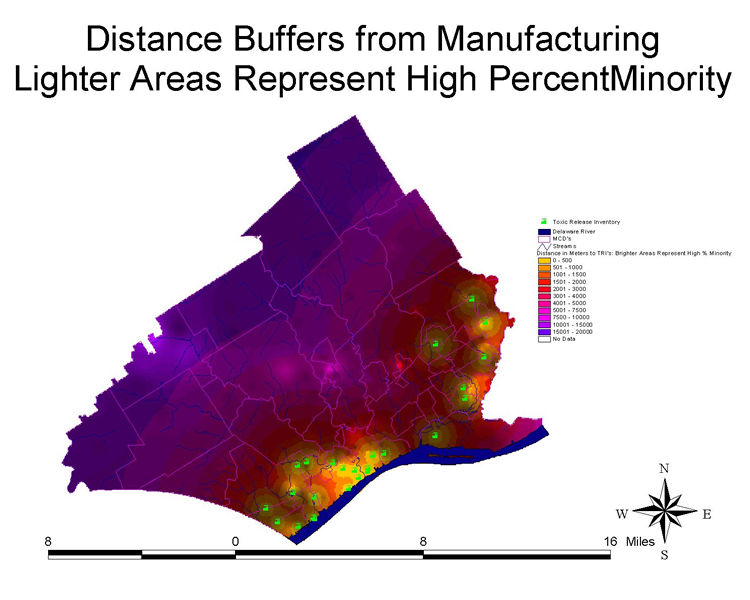
- 9 of 25 manufacturing facilities in Delaware County are in Chester and an additional 7 are within 1 1/4 miles of the city limits in Chester Township, Eddystone, Trainer and Upland. Almost all chemical emissions from manufacturing activity in Delaware County in 1995 (90.7%), came from these manufacturing facilities. 41.7 % of all minority residents in Delaware County live in those municipalities. 32.1% of the persons living in poverty live in those 5 communities.
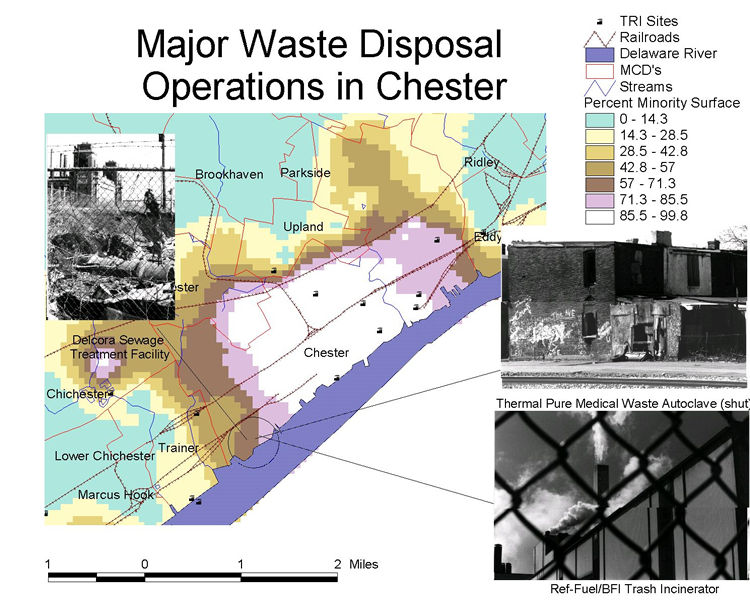
- The fourth largest trash incinerator in the United States is located in Chester, next door to a shuttered medical waste facility and the Sewage Treatment Plant for the entire county. 9900 people live within 1 mile of this complex of waste disposal operations. 67.8 % are minority, 27.4% are living in poverty.
Harrisburg, PA
Movmentech's
first GIS project emerged out of a request from the Harrisburg Area
Branch of the National Association for the Advancement of Colored
People (NAACP) to investigate a proposed medical waste disposal
facility. The NAACP branch was concerned about the fact that the
proposed site for this large-scale operation was located adjacent
to a very low income, predominantly minority neighborhood.
EBIC's
demographic analysis yielded the following information:
-
Click
on the Map to see a Larger Version
|
|
|
|
|
Rochester, NY
EBIC's second GIS project arose when the Citizens Environmental Coalition in Medina, NY contacted us with concerns about toxic emissions form Eastman Kodak Company. In terms of toxic emissions, Eastman Kodak's Rochester facility was the number one polluter in Monroe County, the most polluted county in New York State. Eastman Kodak released over 64 different toxic chemicals on a regular basis. This includes over 6.5 million pounds of toxic air pollutants and 600,000 pounds of toxic water pollutants released in 1996 (the most recent year for which data was available). Kodak released over 2.4 million pounds of the carcinogen dichloromethane into the air in 1996. In addition to these releases there are numerous EPA reports of accidental spills.
Geographic analysis of the surrounding communities, illustrated in maps 2.1 through 2.6, revealed the following:
Status
of this Fight: Ongoing Campaign -
-
Click
on the Map to see a Larger Version
|
|
|
 Household income fig2-3.JPG 159.42 Kb |
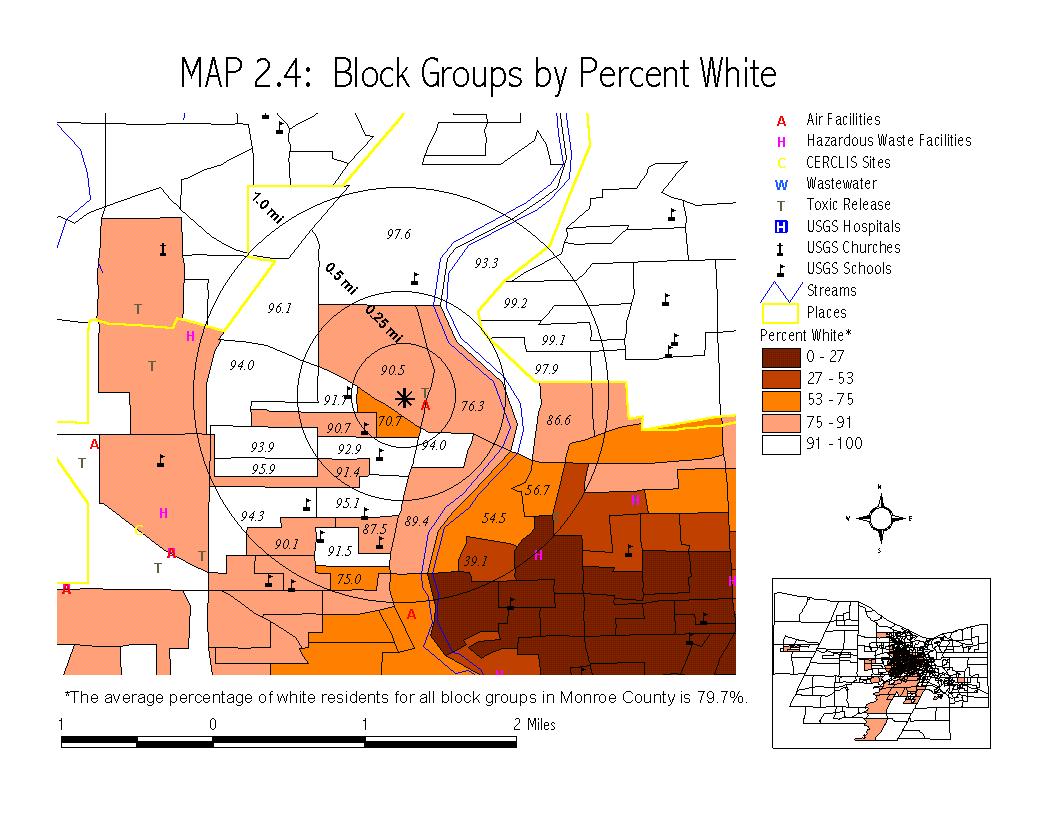 Percent white fig2-4.JPG 133.43 Kb |
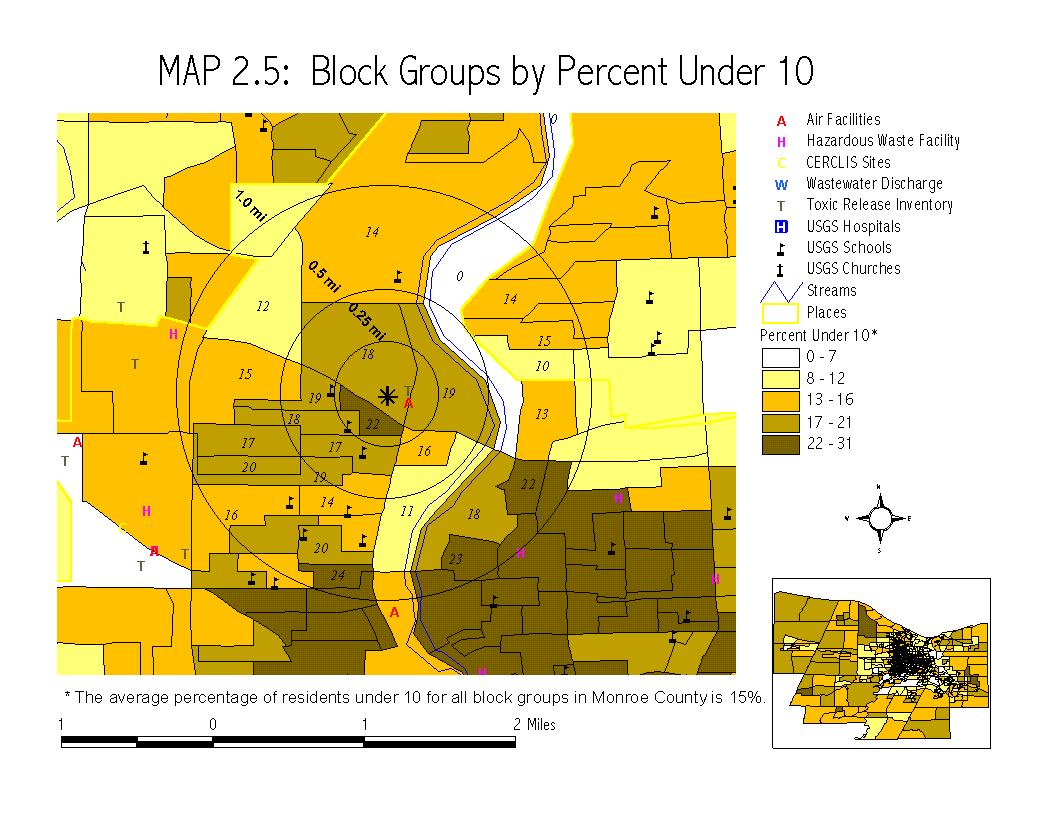 Percent <10 fig2-5.JPG 136.11 Kb |
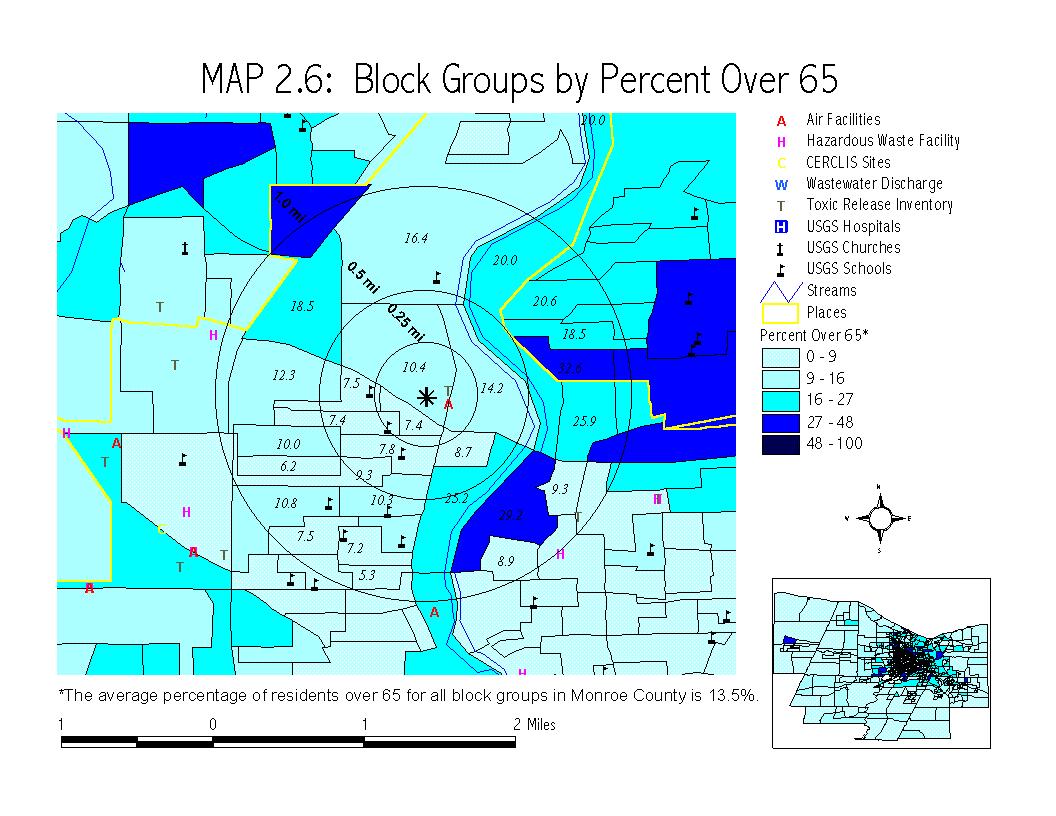 Percent >65 fig2-6.JPG 145.80 Kb |
Birmingham, AL
EBICs third GIS project was requested by the Acmar/Moody Environmental Justice Society in Alabama. These citizens raised concerns over the Acmar landfill, a large, solid waste disposal facility located in Moody, Alabama just outside of Birmingham. The landfill operation was responsible for the uncontrolled release of pollutants into nearby waterways. EBICs corporate research revealed that the landfill was being operated in violation of the law by individuals with criminal records. Federal authorities had linked these operators with New York area organized crime figures.
The Acmar landfill study demonstrates how GIS analysis can be used to help citizens visualize the environmental and social consequences of a dangerous waste disposal operation. This research project helped EBIC document how environmental crimes can impact a broad range of human populations crossing class and race lines.
The
GIS analysis yielded the following information:
The Acmar landfill study demonstrates how GIS analysis can
be used to help citizens visualize the environmental and social
consequences of a dangerous waste disposal operation. This
research project helped EBIC document how environmental crimes can
impact a broad range of human populations crossing class and race
lines.
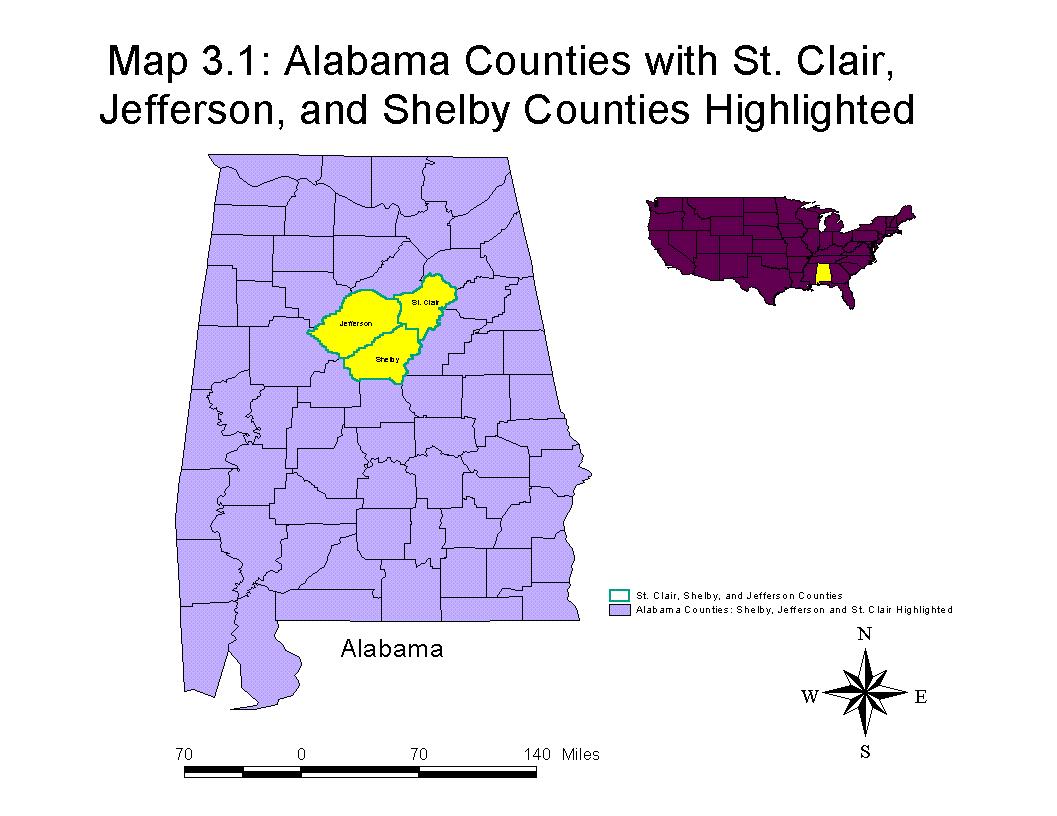 Alabama and study counties fig3-1.JPG 107.09 Kb |
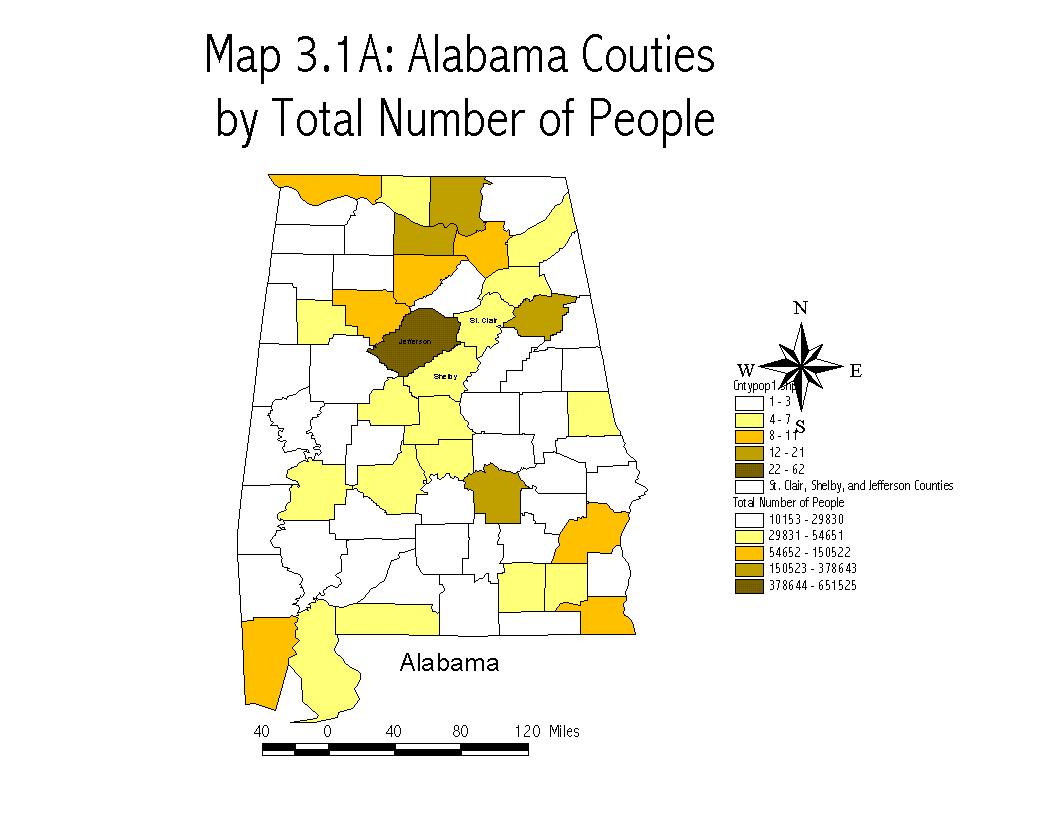 Alabama counties total population fig3-1a.JPG 81.26 Kb |
|
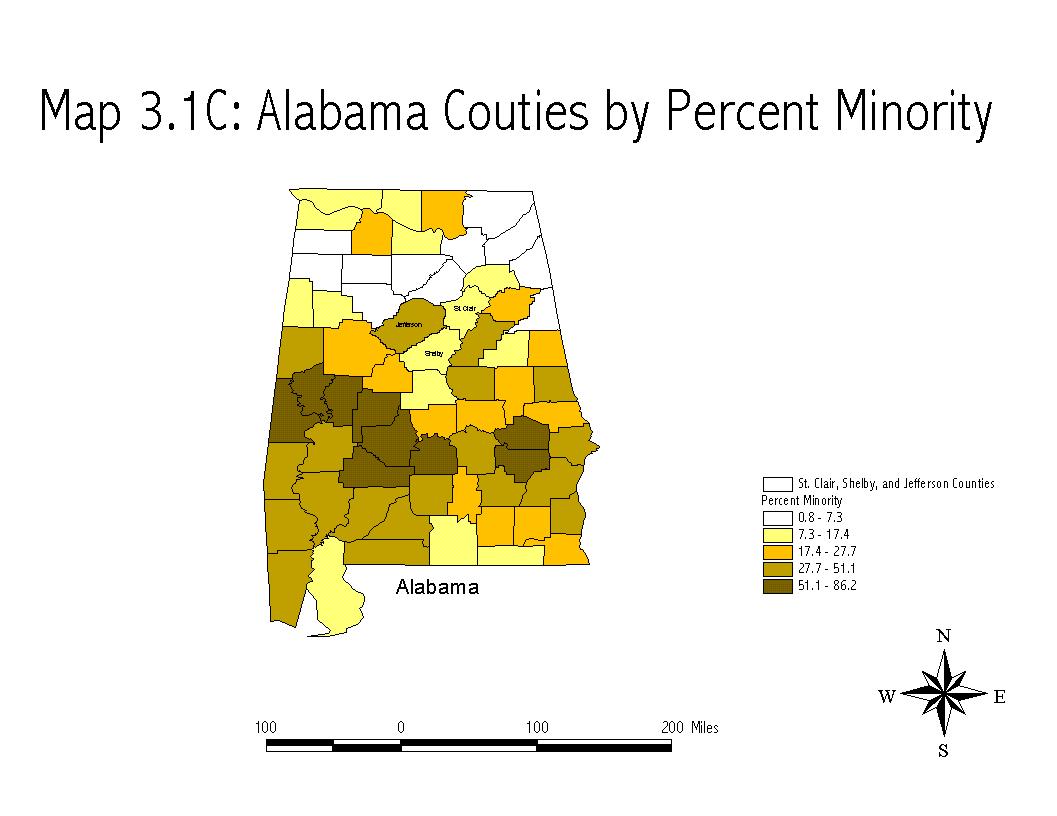 Alabama counties percent minority fig3-1c.JPG 69.27 Kb |
 Alabama counties med hhold income fig3-1d.JPG 71.75 Kb |
 Three county area municipalities fig3-2.JPG 153.92 Kb |
 Three county area water supply fig3-3.JPG 167.63 Kb |
|
 Three county area detail % minority fig3-5.JPG 153.07 Kb |
New Orleans, LA
EBICs fourth GIS project was conducted at the request of the Louisiana Chapter of the Association of Community Organizations for Reform Now (ACORN). Our mapping analysis focused on twelve industrial facilities in Jefferson and Orleans Parishes and the census block groups in their immediate vicinity. The purpose of this project was to aid in an effort to build a labor/community coalition on environmental issues. The overall goal was to summarize the demographic data of the communities adjacent to the industrial facilities and to combine this with environmental data on each facility. The environmental data included emissions, storage and transport of hazardous waste, and spills. We also provided general background information about chemicals being released.
The combination of GIS and environmental analysis was summarized using three separate focus areas or clusters of facilities. Sample maps for one of the focus areas are shown in maps 4.1 through 4.5. The analysis resulted in the following findings :
In response to our continued work with them, Beulah Labostrie, LA-ACORNSs president said, They think that ACORN has Philadelphia lawyers helping us out. They are very close, because we do have Pennsylvanias best mindsfrom the Environmental Background Information Center!
|
|
 Jefferson and Orleans Parishes % Poverty fig4-2.JPG 154.04 Kb |
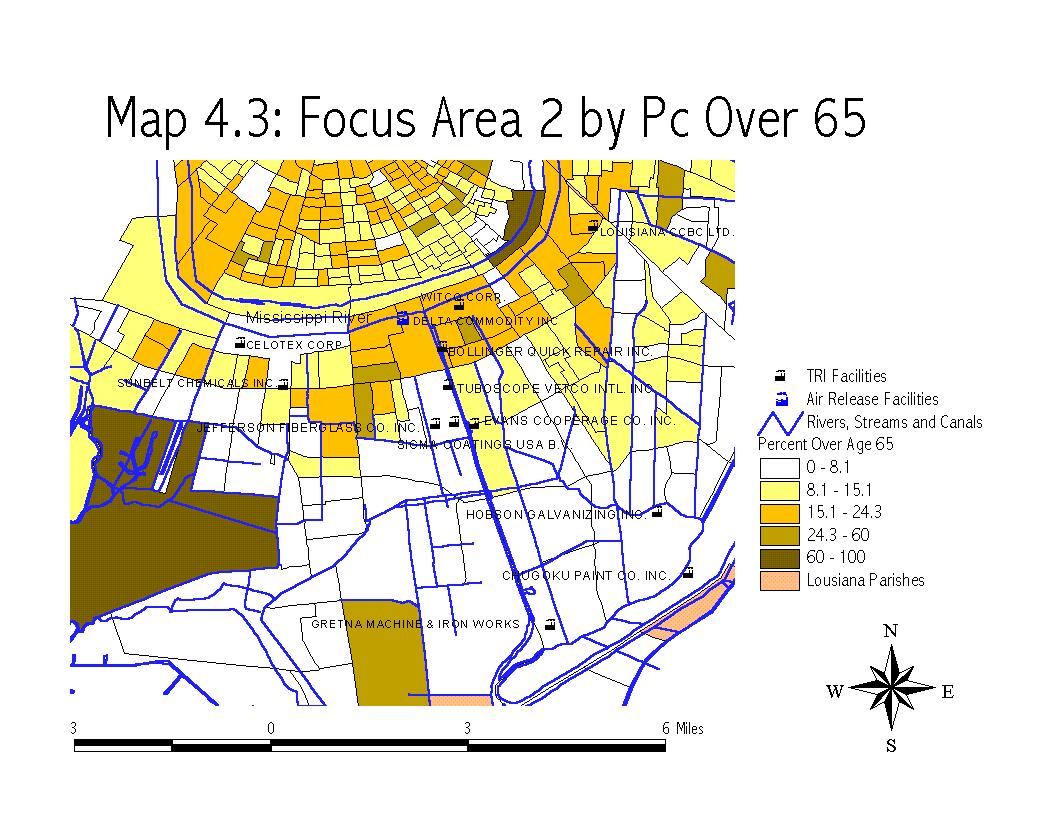 Jefferson and Orleans Parishes % > 65 fig4-3.JPG 162.60 Kb |
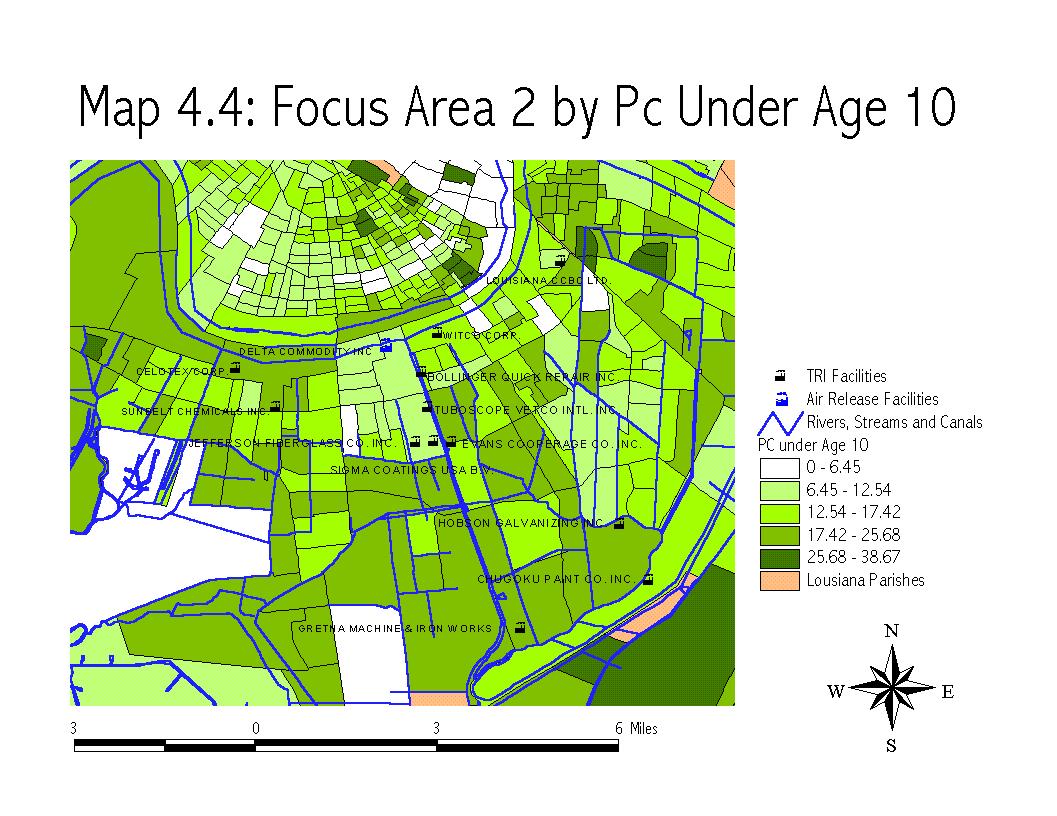 Jefferson and Orleans Parishes % < 10 fig4-4.JPG 162.78 Kb |
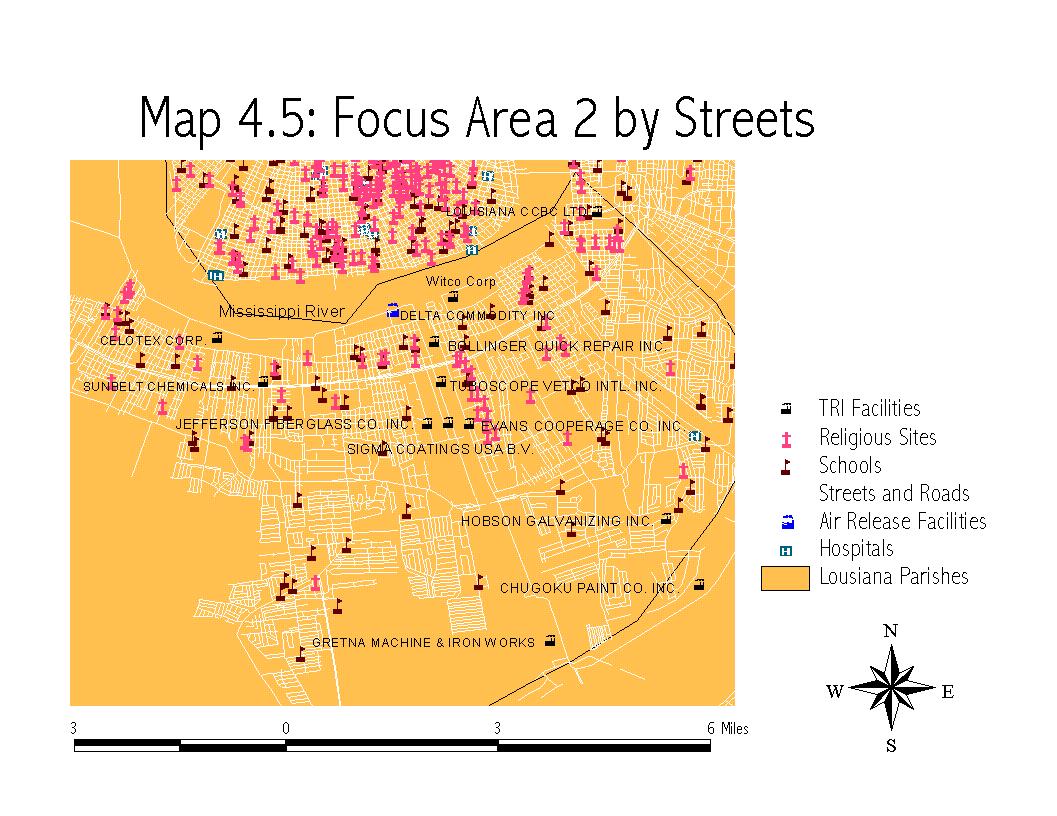 Jefferson and Orleans Streets fig4-5.JPG 147.66 Kb |

Chester,
PA (click
for the full draft report)
EBIC
was invited by the Chester Residents Concerned for Quality Living
to examine the community structure of Chester, Pennsylvania using
GIS to help visualize demographic conditions in communities impacted
by manufacturing and waste disposal facilities. The results show
that the facilities in Delaware County and Chester are located in
areas wiht high percentages of people living in poverty and people
of minority status with low levels of educational attainment. According
to the 1990 Census,
Click
on the Map to see a Larger Version
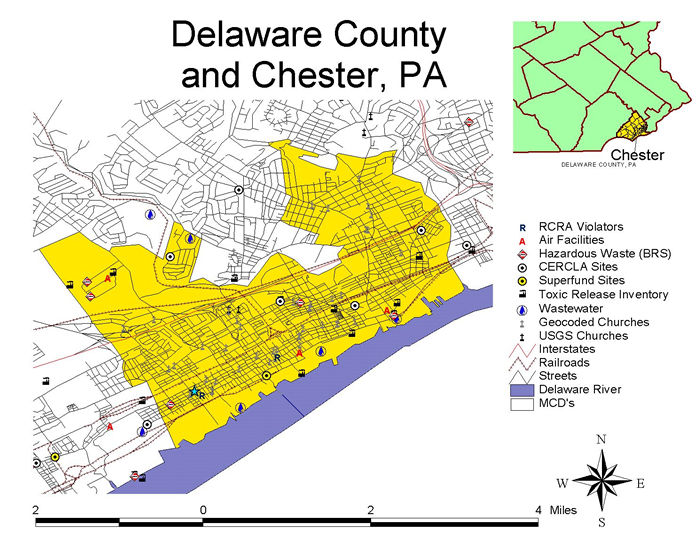 Toxic Facilities in Chester, PA chester1.jpg 112.48 Kb |
|
 Education and Proximity to Toxic Releases chester3.jpg 72.14 Kb |
 Poverty and Proximity to Toxic Releases chester4.jpg 57.95 Kb |
 Minority Status and Proximiy to Toxic Releases chester5.jpg 62.16 Kb |
 Chester, Delaware Cty: Demographic Profile chesterchart1.jpg 55.90 Kb |
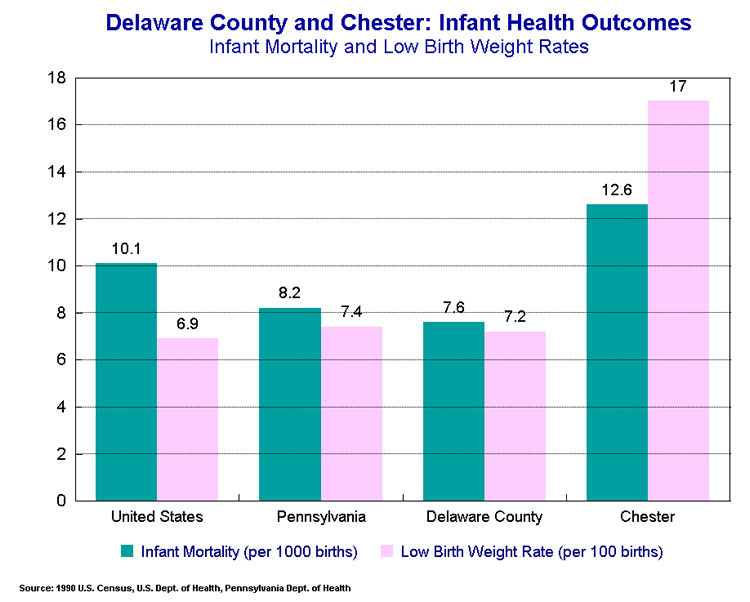 Chester Infant Health Outcomes chesterchart2.jpg 61.71 Kb |
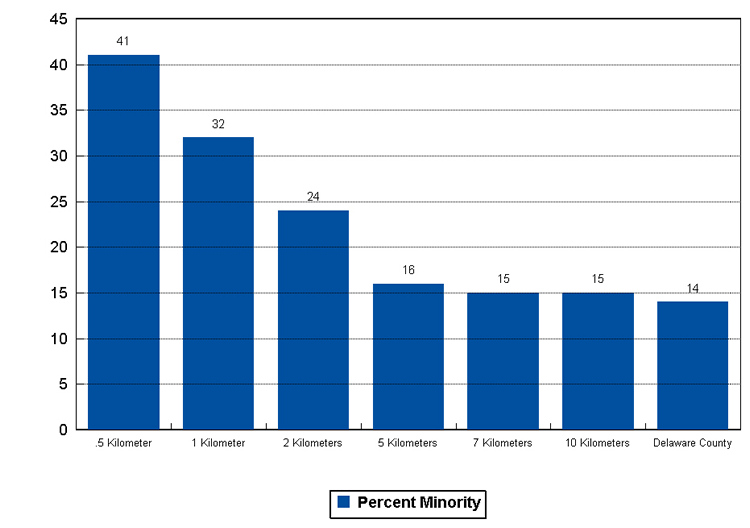 Delaware Cty Proximity to Toxic Releases chesterchart3.jpg 74.02 Kb |
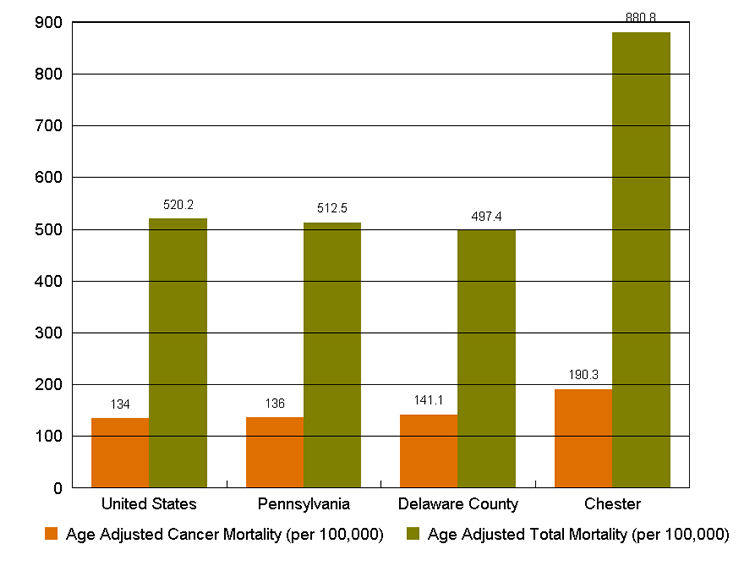 Chester Mortality Rates chesterchart4.jpg 43.05 Kb |
This project is being developed for the Pennsylvania Environmental Network. It is an analysis of the spatial relationship between the distribution of human population, sources of environmental risks, and major transportation routes. The project is aimed at the problem of environmental justice in Pennsylvania and New Jersey. Preliminary results reveal interesting details which we believe add to our understanding of the origins and dimensions of social inequality. Our data shows inequality at multiple levels of geographic scale but not at all scales. Finer geographic units of scale tend to undercut the arguement that polluting facitilities are located in poor and minority neighborhoods. However, these finer scale analyses actually redirect social inequality more precise spatial analysis lines. We believe this approach also advances the use of Geographic Information Systems in the understanding of important human social problems.
Preliminary
findings of this analysis tell us that proximity to transportation
routes is closely related to the presence of sources of environmental
risk. (Here risk is indicated by facilities reporting
the release of toxic chemicals to the EPAs Toxic Release Inventory
and facilities permitted to handle hazardous waste under the Resource
Conservation and Recovery Act.) These findings imply
that a thorough inquiry into issues of environmental equity should
look at the convergence of these phenomena and their relationship
to the distribution of human populations. A thorough analysis
should also be prepared to address multiple levels of scale and
should be explicit about how research decisions regarding the
design of the analytical model impact the results of the analysis.
Appalachian Clearcutting
EBIC
assists groups such as the Allegheny Defense Project (ADP) in
demonstrating environmental degradation at the ecosystem level.
GIS technology, together with environmental data made publicly
available by government agencies, can be used to illustrate such
problems as water contamination, forest decline, loss of
wetlands and open space, and the disappearance of species.
When ecosystem data is used together with socioeconomic and business
information, it becomes possible to demonstrate the social consequences
of environmental degradation and dispel the myth that ecological
preservation is incompatible with economic prosperity. ADP
requested EBIC to provide maps to support its efforts to have
the Tionesta Natural Area upgraded to a federally protected wilderness
area. We are currently helping them develop a rationale
for the proposed boundary of the new area based on watershed boundaries.
We are also contributing a calculation of the mileage of
existing roads in the area as well as a few specific maps for
a paper they seek to have published in Natural Areas Journal to
call attention to the issue.
Human Health
Connecticut Coalition for Environmental Justice
The health survey form was designed and circulated by members of Organized Northeasterners/Clay Hill and North End (ONE/CHANE) of Hartford under a grant from the U.S. Environmental Protection Agency. ONE/CHANE is a neighborhood organization based in the North End of Hartford. It is affiliated with the Hartford Environmental Justice Network (HEJN). HEJN is a coalition of twenty-two health and neighborhood organizations and the local affiliate of the Connecticut Coalition for Environmental Justice (CCEJ). CCEJ is an umbrella group for a network of grassroots activists working in urban areas of Connecticut on local environmental issues (see Appendix II for a description).
The Coalition works with regional groups such as the Toxics Action Center (TAC). It was through the course of two conferences in Connecticut and Massachusetts hosted by the TAC that the CCEJ's Dr. Mark Mitchell met and began working with Dr. Brian Lipsett of the Environmental Background Information Center (EBIC). Dr. Mitchell is President of CCEJ, a director on the Greater Hartford Hispanic Health Council, and former director of the Hartford Health Department. He has a MD from the University of Missouri and a Masters in Public Health from Johns Hopkins. Brian Lipsett is organizing director of the EBIC and has a PhD in Administration of Justice from Penn State University.
Results
Dr.
Mitchell and CCEJ derived preliminary results from the analysis
which showed that asthma is fairly evenly distributed among households
throughout the city. However, a preliminary analysis of cough
and sore throats lasting longer than two weeks and respiratory
problems lasting longer than one month appeared to be more common
in the southern part of the city. This result is consistent with
anecdotal reports from residents that many Hartford residents
get "colds" that last for months. This is contrary to the duration
of viral upper respiratory illness (the common cold) reported
in the medical literature which is described as lasting from 4
to 10 days.
Subsequent analysis of the data provided further support for these
results and led to the observation that the Hispanic population
is more at risk for asthma, colds lasting more than one week and
other respiratory problems lasting more than one month. We define
these observed respiratory health problems of people in Hartford
as "Chronic Recurrent Respiratory Ailments (CRRA)." What follows
is a more detailed discussion of our findings.
The Connecticut Coalition for Environmental Justice is an organization that was established in Hartford in the summer of 1997. It was formed in response to community concerns about the siting of yet another fossil-fueled power generator in South Hartford as a consequence of the closure of Connecticut's nuclear power plants. Residents were concerned that this was the tenth power generator to be situated next to a neighborhood that is 80% Black and Latino and that this neighborhood is already overburdened with significant sources of air pollution, and its inhabitants suffer accordingly. CCEJ researched the issue, raised public awareness about the relationship between air pollution and respiratory health, requested a public hearing, and arranged the first environmental public information session sponsored by competing neighborhood groups. This was a highly successful strategy that led to an agreement whereby Northeast Utilities took the unprecedented step of removing the new power generator.
Public Interest Law Center of Philadelphia
The Public Interest Law Center of Philadelphia (PILCOP) in asked EBIC to help them research, analyze and map community health in Pennsylvania in order to identify communities in need of environmental protection. PILCOP is developing health-based criteria to screen sites targeted for environmentally hazardous facilities in PA. In support of this work, we are thematically mapping statistics for four health outcomes in Pennsylvania including total mortality, cancer mortality, infant mortality, and low birth weight. PILCOP's proposal represents a bold departure from the cumulative risk assessment model favored by regulatory authorities. Their novel approach is to identify communities plagued by substandard health and then take them off the map as potential hosts for any further environmental insult or degradation.